Task 1: Sensitivity analysis of seismic and gravity data
The combination of gravity and magnetic satellite data (GOCE and Swarm) with seismological observations, within an integrated geophysical and petrological modelling approach has proven to be a powerful tool to constrain the thermochemical structure of the lithosphere and upper mantle (down to 400 km depth), reducing the uncertainties of modelling data sets independently.
Extending this approach to the whole mantle is a key element to understand the link between the deep mantle structure and surface processes within a dynamic Earth framework (4D Deep dynamic Earth). This requires a consistent combination of seismological (surface waves, body waves, normal modes), deformation (tidal tomography), geodynamic (dynamic topography and CMB), and magnetic (core flow, tidal magnetic field, Sq magnetic variations and magnetic storms) data and models.
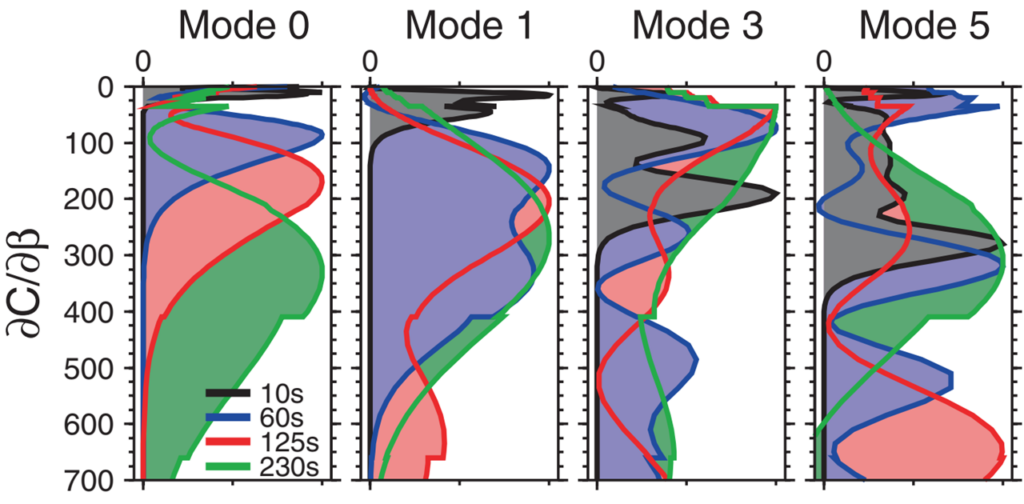
Seismic data offer abundant information on the thermochemical structure of the Earth’s mantle. Surface waves are our richest source of evidence on the thermal structure and thickness of the lithosphere and on the temperature of the underlying convective mantle down to the transition zone (410-660 km depth). They also constrain seismic anisotropy in the upper mantle, indicative of the past and present deformation and flow. Surface-wave overtones (the higher modes) make up the S and P waves and are sensitive to both the upper and lower mantle structure. Evidence on the deep lower mantle comes primarily from normal-mode and body-wave data.
In Task 1, we investigate and quantify the sensitivity of the different data to the thermochemical Earth structure, starting with multi-mode surface waves. The sensitivity analysis and the assembly of the large global datasets will feed into the joint analysis and inversion of the satellite gravity data with seismic and other data, leading to the development of new, dynamic models of the Earth in the 4D Earth project.
Workpackages Task 1
Sensitivity tests:
• Lateral resolution: 3D tomography vs phase velocity maps inversions.
• Radial and azimuthal anisotropy.
• Resolving power of surface wave overtones in the transition zone. To what depths in the lower mantle does this data type provide resolving power?
• Optimal parametrization of the transition zone in terms of temperature and composition (link to petrology task).
• Coupling between surface wave overtones and magnetic Sq variation, diurnal tidal magnetic field and magnetospheric field data to constrain the transition zone and upper lower mantle (link to petrology and magnetic data tasks).
Sensitivity tests:
• Resolution tests using different seismic tomography strategies: ray-based seismology and finite frequency/waveform seismology.
• Test the effect of adding travel time data from other complementary seismic databases, particularly in oceanic regions and in the southern hemisphere. • Test the effect of including anisotropy and attenuation in resolving whole mantle structure.
• Analyse the coupling between surface waves and body waves in resolving the thermochemical structure of the transition zone, where the resolution of the two data sets overlaps.
• Sensitivity of body wave tomography and normal modes to LLSVP and ULVZ (link with petrology and magnetic data tasks).
• Compatibility between body wave tomography, and normal modes and tidal tomography models available from the literature.
Sensitivity tests:
• Evaluate the optimal parametrization of the lower mantle in terms of computational time and lateral and vertical resolution based on the gravity field data.• Evaluate the trade-off between matching gravity data and seismic data; design of an iterative scheme to match both data sets simultaneously.
• Evaluate the coupling between gravity data and dynamic+isostatic surface topography, in particular the role of the continental crust structure (link to geodynamics tasks).
• Sensitivity of gravity field data to LLSVP (link with petrology and magnetic data tasks).
Sensitivity tests:
• Determine the sensitivity of surface wave phase velocities and the gravity field to global 3-D S-wave velocity and density distribution in the mantle.
• Determine the sensitivity of surface wave phase delays and the gravity field to S-wave velocity and density. Realistic distribution of earthquake and seismic station locations will be used and great-circle propagation of surface waves will be assumed.
• Include simplified calculations of body wave travel times into the sensitivity analysis. Travel times will be forward calculated by raytracing in a 1-D reference model and integrating model velocities along the reference rays. With body waves, P-wave velocity will be added as a (potentially) recoverable subsurface parameter.